
Login

Shoutbox
You must login to post a message.
renatoa
07/26/2024 3:49 PM
Bill grubbe and Jk, 
allenb
07/26/2024 5:15 AM
Spiderkw Welcome to HRO!

renatoa
07/24/2024 8:31 AM
ramiroflores and John123,

 ?
?
?renatoa
07/21/2024 1:18 AM
 , Luislobo
renatoa
07/19/2024 11:28 AM
Koepea,
Forum Threads
Newest Threads
Skywalker roaster modsBackground Roast Iss...
Hello from Arkansas
TC4ESP
Green coffee reviews
Hottest Threads
| Skywalker roaster... | [375] |
| TC4ESP | [115] |
| War on Farmers by... | [47] |
| Adventures in flu... | [26] |
| Hello! (soon) Roa... | [17] |
In Memory Of Ginny

Donations
Latest Donations
dmccallum - 10.00
JackH - 25.00
snwcmpr - 10.00
Anonymous - 2.00
Anonymous - 5.00
dmccallum - 10.00
JackH - 25.00
snwcmpr - 10.00
Anonymous - 2.00
Anonymous - 5.00
Users Online
Guests Online: 4
Members Online: 0
Total Members: 8,394
Newest Member: Bill grubbe
Members Online: 0
Total Members: 8,394
Newest Member: Bill grubbe
View Thread
Who is here? 1 guest(s)
 SR800/SR540 Fan Current TC4+
|
|
| dwertz |
Posted on 01/02/2023 6:25 PM
|
|
Newbie  Posts: 45 Joined: October 19, 2022 |
Here is the ROR for that last roast. I wonder what causes that ripple with about 1/2 a minute period. I should monitor my line voltage to see if anything crazy is going on. Renatoa, I am noticing that your ROR has a similar look to it. I have observed similar when using Artisan even when I am not touching the heat or fan controls. I wonder if it is related to "kangoo jumping". Perhaps I will really stay on top of the fan speed for the next roast and have the fan just fast enough for good bean rotation, but no jumping.
dwertz attached the following image:
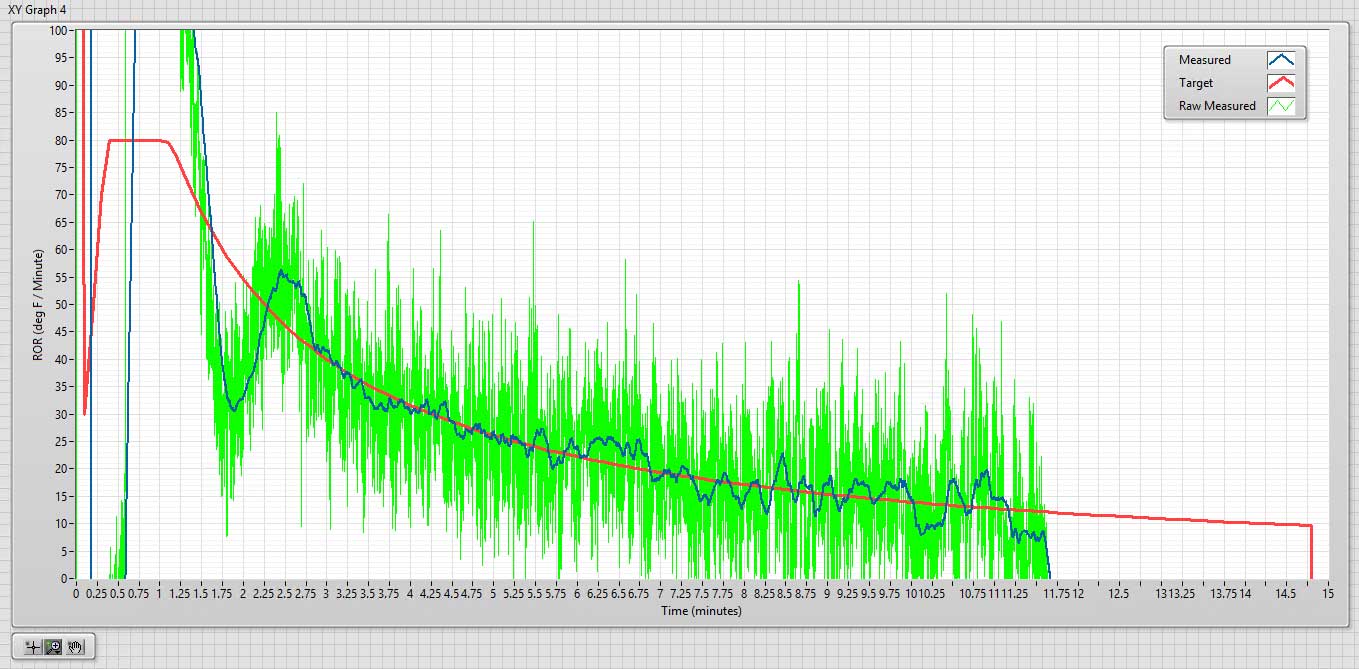
Edited by dwertz on 01/03/2023 12:44 AM |
|
|
|
| renatoa |
Posted on 01/03/2023 2:00 AM
|
|
Administrator Posts: 3104 Joined: September 30, 2016 |
What are you using for computing and graph plotting ? Ror is like a magnifier for data changes, and for total convective machine as FB the turbulence is pushed to extremes. In the bed of coffee beans happens things like the channeling in an espresso puck, hot air gusts that find an escape way trough the beans without much resistance, thus exhausting still very hot. Such gusts, when hitting the sensor produces what we see on the graph. That's why I prefer the asymmetric builds for FB, the air escape and beans sensor could be on opposite sides of roast chamber. Same for power control steps, 1% control resolution is too rough for a FB, where space is too small to have room for melange and averaging as in a large oven. 1% power step led to about 3 C degrees of hot air increase, this can't pass unnoticed by a fast sensor. That's why maybe is preferable a slower sensor, having lag time of about 10 seconds, as is the average 1% power step change period. |
|
|
|
| dwertz |
Posted on 01/03/2023 2:54 AM
|
|
Newbie Posts: 45 Joined: October 19, 2022 |
I am using the LabVIEW programming environment. The phase angle control is actually running on an FPGA with a 40MHz loop rate. so, the control resolution is much finer than 1%. The actual PID loop is running on a real time controller and the loop rate is paced by the Thermocouple module. I have been using best 60Hz rejection and the rate is 8.3333333 Hz. I can kick the loop rate up to 50Hz with the module I am using. The NI-9219. The system is NI Compact RIO https://www.ni.co...ctrio.html Just slightly overkill for the task  I work for NI and had the stuff laying around. It was WAY faster for me than trying to learn how to do it in Artisan. Once I get all the control stuff to my liking, I will port it over to a $6.00 Arduino nano. I work for NI and had the stuff laying around. It was WAY faster for me than trying to learn how to do it in Artisan. Once I get all the control stuff to my liking, I will port it over to a $6.00 Arduino nano.I will look carefully at the bean mass to see if there is an area on the surface that is calm and might be a better location for the thermocouple. Edited by renatoa on 01/03/2023 4:00 AM |
|
|
|
| renatoa |
Posted on 01/03/2023 3:56 AM
|
|
Administrator Posts: 3104 Joined: September 30, 2016 |
With PAC the main problem is not about resolution, but precision and time stability. The effective power delivered into load is hugely affected by the repeatability and precision of zero cross detection (ZCD). Spread of ZC in a 100 microseconds window means nothing for ICC, under 0.1% of power, because happens at sine start, where power is very small... but a jitter of 100 microseconds, when propagated at sine peak, in the 50% ballpark, means 1% of power ! And ZC with 100 microseconds accuracy is extremely hard to get, trust me, in big industry it's an achievement. On my residential mains measured up to eight false ZC in 400 microseconds window ... When using PAC for a fan, I am capable to hear tone variations when spinning freely, no load, due to this ZC detection issue. I am pretty sure they are due to ZC, because same fan, using an universal motor, when powered from DC, has a very stable tone pitch. Not sure what averaging are you using for the graph, I suggest try Savitsky Golay filtering, that does both derivative and filtering in same step. In my setup I am using 9 values (seconds) window size, the linear model, for simpler computations, there is no need to use cubic or quartic for so small variation in such narrow window. https://en.wikipe...efficients |
|
|
|
| dwertz |
Posted on 01/04/2023 1:03 AM
|
|
Newbie Posts: 45 Joined: October 19, 2022 |
OK you piqued my interest. My FPGA is actually timing the rising and falling edges of the zero crossing circuit and using the center as the reference for the PAC. I exported the pulse width for every zero crossing for a 10-minute run. I also exported the zero crossing to zero crossing interval for every zero crossing. included is the raw and smoothed data. The RobotDyn dimmer actually has an interesting property. The higher the voltage of the mains voltage, the narrower the zero-crossing pulse. In Theory we can use the zero-crossing pulse width to adjust the phase angle to compensate for mains voltage variation. The smoothed pulse width is suspiciously similar looking to the ROR curve and I am wondering if doing the voltage compensation will smooth things out. The zero-crossing time interval plot is an indication of the frequency stability of the mains. Short term, I am not seeing more than 10 usec variation. And to be fair if one pulse comes in a little early others will come in late. It is not fair to judge power output on one pulse. Really you need to look at the average over the similar interval you would use for your ICC frame. I was thinking about what you said about the thermocouple and the turbulent air flow allowing blasts of hot air not cooled by the beans. What do you think of using multiple thermocouples and using the minimum temperature from any thermocouple as the process variable? The thought is that the coolest one will have had the least amount of bypass air and will have better contact with the bean mass.
dwertz attached the following image:
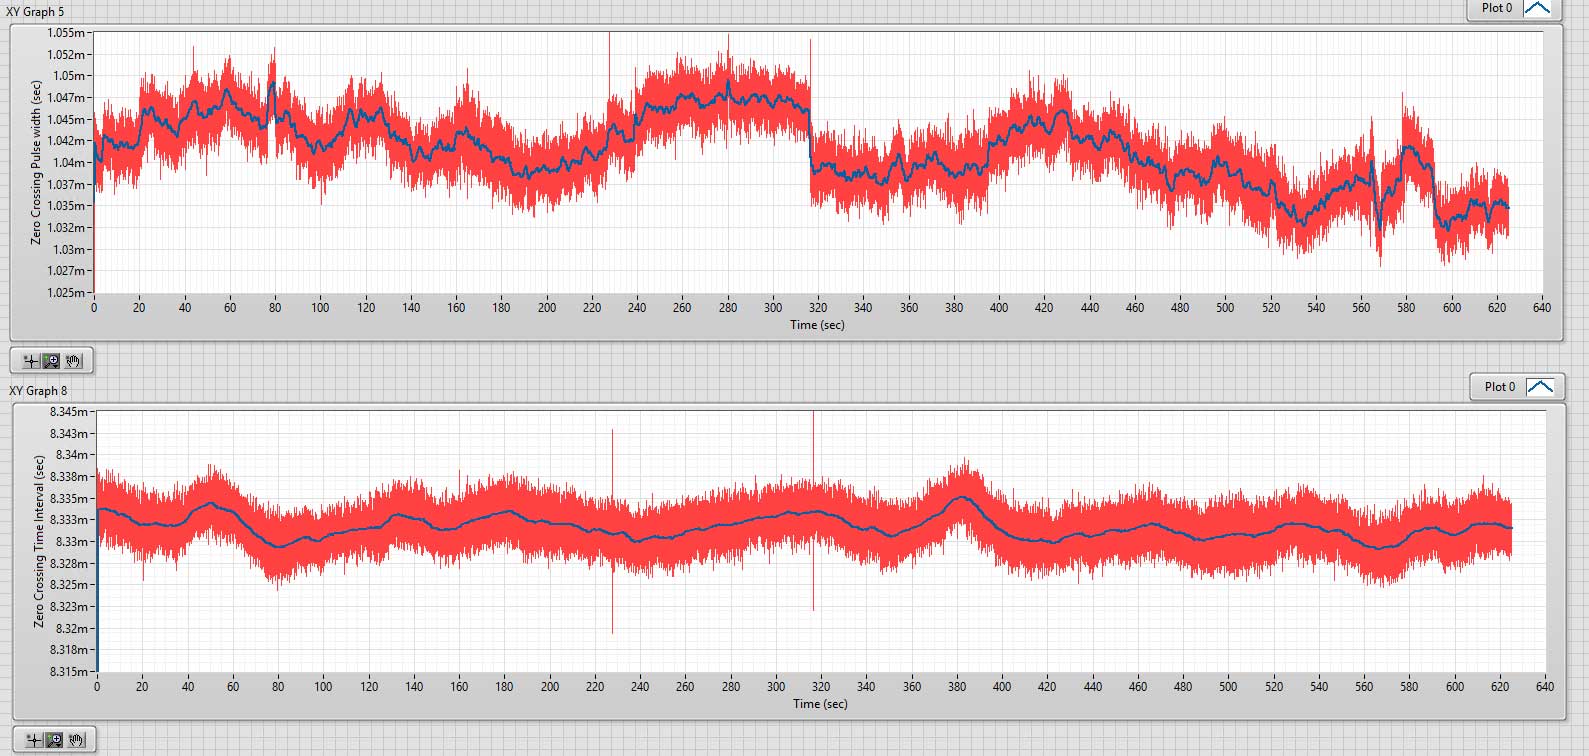
Edited by dwertz on 01/04/2023 1:23 AM |
|
|
|
| dwertz |
Posted on 01/04/2023 1:27 AM
|
|
Newbie Posts: 45 Joined: October 19, 2022 |
I tried out the Savitsky Golay filter and strangely I get the exact same results as moving average when the order is set to 1. Higher orders are different, but I am finding for my data set the 1st order smoothed the best.
dwertz attached the following image:

|
|
|
|
| renatoa |
Posted on 01/04/2023 2:01 AM
|
|
Administrator Posts: 3104 Joined: September 30, 2016 |
Yes, depending on the moving average window, you can obtain similar looking results, but SG is faster and preserve the peak shape property better than any other method. So I read in manuals  but can be seen easily if plotting both on same graph. Or generate numbers series in excel in two columns side by side for all methods. but can be seen easily if plotting both on same graph. Or generate numbers series in excel in two columns side by side for all methods.In real world, the effect is that for a 9 seconds SG window a spike will be noticed 4-5 seconds faster than using the same weight moving average. To relate these numbers to actual equipment that many people is using, I mean the TC4, when they set 75-80-85 filter ratio(s), the readings are delayed by 4-5-6 seconds respectively versus the acquired values. And this filtering is applied twice ! for BT displayed values, and then again for computed RoR. A 9 seconds SG filters better even than 85% rolling avg, and introduces a delay of only 3 seconds, just one, no multiple passes filter. Edited by renatoa on 01/04/2023 6:27 AM |
|
|
|
| renatoa |
Posted on 01/04/2023 6:17 AM
|
|
Administrator Posts: 3104 Joined: September 30, 2016 |
Quote dwertz wrote: I was thinking about what you said about the thermocouple and the turbulent air flow allowing blasts of hot air not cooled by the beans. What do you think of using multiple thermocouples and using the minimum temperature from any thermocouple as the process variable? The thought is that the coolest one will have had the least amount of bypass air and will have better contact with the bean mass. I would rather average them, or graph the average vs the coolest, and see which is more reliable. Averaging has the advantage you don't need more TC and more channels/acquisitions, and software changes for picking the coolest. You can simply use a longer section of TC wires, about the perimeter of the roast chamber length, and twist them in other 4 places, starting from the tip junction, at distances roughly equivalent to 1/4 of perimeter, thus 90 degrees each. Will create so another 4 additional junctions, that will generate each their own temperatures/voltages, and the result will be an averaging of them. Regarding the plotted values... I have first to understand what is there, then digest, so replying later |
|
|
|
| dwertz |
Posted on 01/04/2023 4:25 PM
|
|
Newbie Posts: 45 Joined: October 19, 2022 |
I did an experiment today. I set the fan at 50% and the heater at 50% and logged Temperature, ROR and zero crossing pulse width. The experiment was designed to look at any correlation between the pulse width and the temperature / ROR. The data is plotted with the temperature offset to get it on the same display as the ROR and the pulse width was plotted as deviation from the mean pulse width. Actually, the negative of the deviation since in theory narrower pulses correlate to higher line voltage. As hoped for there is correlation between the pulse width and the temperature / ROR. So, it should be possible to modulate the TRIAC phase angle as a function of zero crossing pulse width to stabilize both fan speed and heater power. Is this going to make any sort of difference to the coffee? I am not holding my breath. I have had some pretty nasty looking roast curves that resulted in fine tasting coffee. But it may make for prettier looking roast curves and bragging rights
dwertz attached the following image:
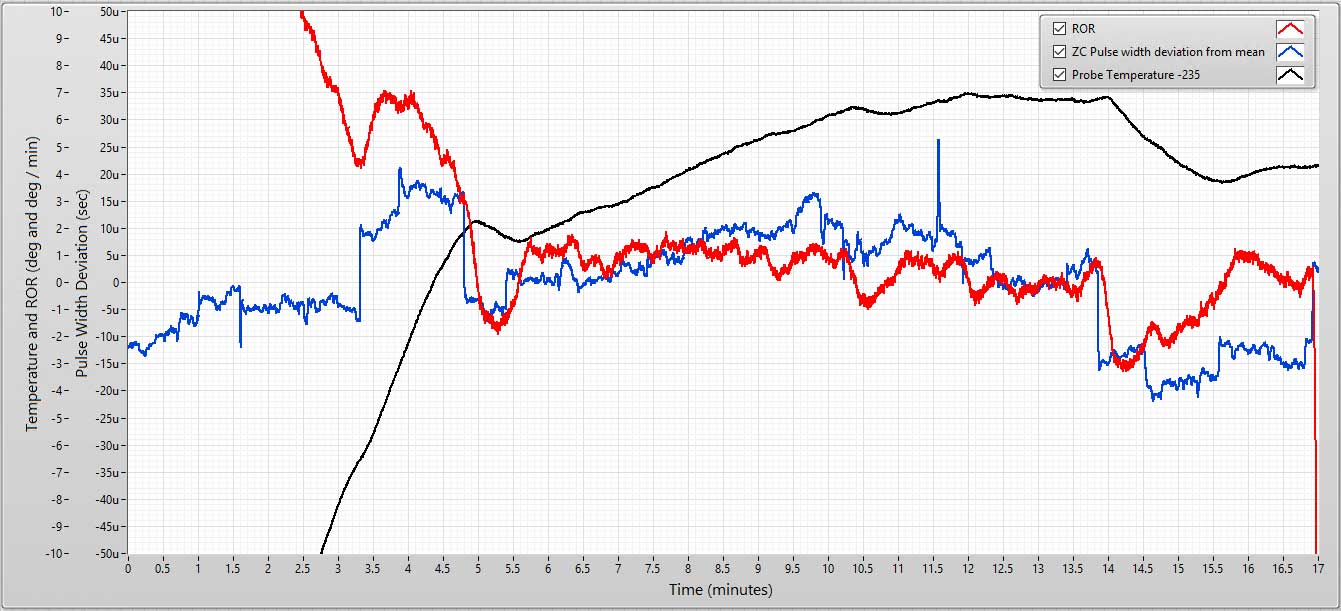
Edited by dwertz on 01/04/2023 4:31 PM |
|
|
|
| Gullygossner |
Posted on 01/15/2023 12:44 PM
|
|
1/4 Pounder  Posts: 95 Joined: January 06, 2019 |
Quote When I saw your labview screenshots I knew you meant business |
|
|
|
| dwertz |
Posted on 01/17/2023 1:14 AM
|
|
Newbie Posts: 45 Joined: October 19, 2022 |
Quote LOL I Definitely pulled out the big guns! The trick will be porting it to an Arduino and Artisan. Not sure when though. I am actually really digging just controlling the fan and watching the heat control bouncing around like crazy and nice smooth curves appearing. Our power was out for a week due to some storms, but I did just add line voltage compensation based on the zero-crossing pulse width. Used to be you would hear the fan slow down some when you click the heater on and speed up when turning it off. No more, it is rock solid now. I will work on the PID tuning next. I am still using the gains from day one, but it is working well enough. Included a picture of the latest roast. I think it is time to start experimenting with roast profiles next, but I have found I am really liking the coffee I am getting from this curve and just adjusting the development time / final temperature.
dwertz attached the following image:

|
|
|
|
| renatoa |
Posted on 01/17/2023 3:22 AM
|
|
Administrator Posts: 3104 Joined: September 30, 2016 |
You should lower the rate on the final approach, the curve above shows a constant steady rise. I would try an asymptotic to about 450F. Also, please, can you add RoR plot to your graphs, some old brains as me are judging more the variations than absolute values. |
|
|
|
| dwertz |
Posted on 01/17/2023 11:21 AM
|
|
Newbie Posts: 45 Joined: October 19, 2022 |
Quote renatoa wrote: You should lower the rate on the final approach, the curve above shows a constant steady rise. I would try an asymptotic to about 450F. Also, please, can you add RoR plot to your graphs, some old brains as me are judging more the variations than absolute values. I have a ROR plot in post 66. But I will add ROR to the main graph. The existing curve uses a 1/x for ROR. What is a good ROR target through first crack? |
|
|
|
| dwertz |
Posted on 01/17/2023 3:59 PM
|
|
Newbie Posts: 45 Joined: October 19, 2022 |
Along these lines? I switched to a spline for easy local changes. This isn't really much different since I stopped the roast around minute 11. Are you suggesting I reduce the ROR even faster?
dwertz attached the following image:
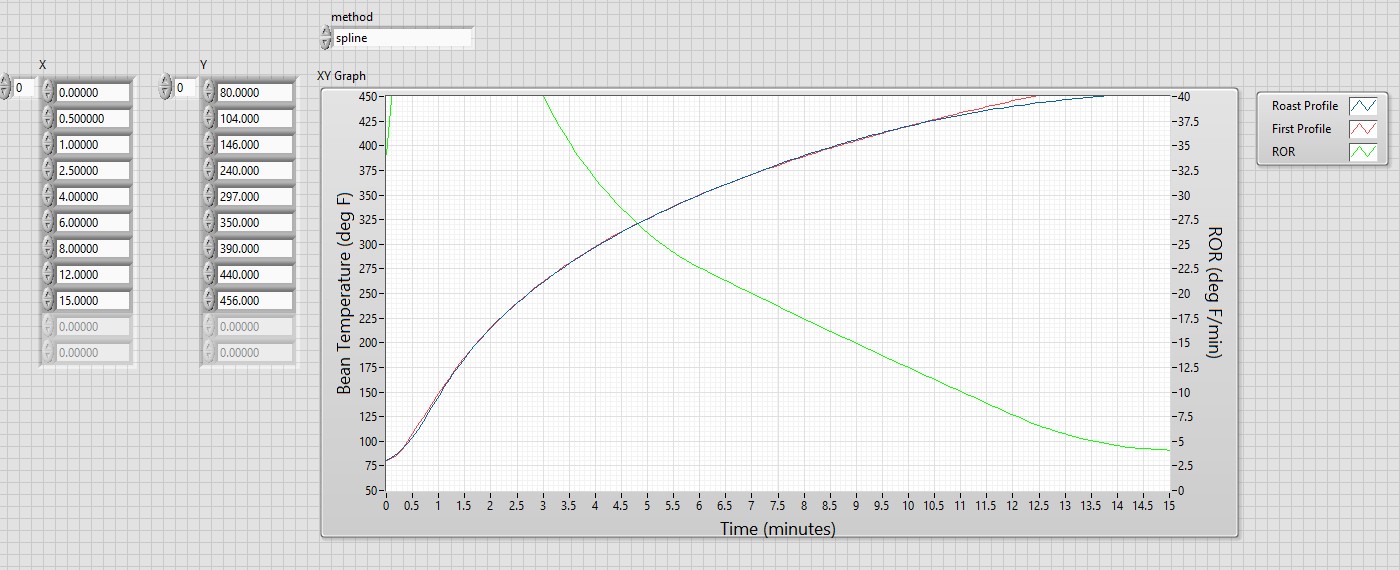
Edited by dwertz on 01/17/2023 4:07 PM |
|
|
|
| renatoa |
Posted on 01/18/2023 2:35 AM
|
|
Administrator Posts: 3104 Joined: September 30, 2016 |
Check here in other thread just posted some thought on my development phase driving strategies: https://homeroast...post_76300 This RoR looks pretty unreal in my eyes, how smooth it is and no showing any perceivable signs of flip and crash... on my data sets I can put a finger on the FC moment debut with an error of 15 seconds, without hearing any sound. Not sure if this is a real time plot, or after the roast. If real time, for me would be a nightmare to follow the roast evolution. After dry ending I use every RoR bump as a sign I need to reduce power, in order to prepare the FC entrance with the right value. May I suggest you to put your data in a csv file in Artisan format, and do the plots with Artisan, to have an image familiar to most of us ? Not a critique, but in such cases excessive filtering is not helping at all. |
|
|
|
| dwertz |
Posted on 01/18/2023 11:00 AM
|
|
Newbie Posts: 45 Joined: October 19, 2022 |
My bad, I was not clear. The profile above is the designed profile not measurements from a roast. The ROR plot shown is just the derivative of the blue profile curve. The red plot is the original profile you said I should reduce the ROR on near the end. You are looking at the "Profile Designer" if you will. Trust me, my measured ROR will look much more real  |
|
|
|
| dwertz |
Posted on 01/23/2023 11:03 PM
|
|
Newbie Posts: 45 Joined: October 19, 2022 |
Latest roast. I need to work on the PID tuning. I need to do a little work on the voltage compensation using the ZC pulse width. I think the pulse width is temperature sensitive. I am going to change to using the mean of the last minute or two as the reference pulse width. By the time I finished the second roast, the compensation was adding a lot to both the fan and heater control values. The PID did compensate, but my manual fan control settings were getting pretty skewed. I will work on getting this data into Artisan for easier digestion for everyone who is not me  Also going to add markers for the crack beginning and ending. I also want to try the thermocouple averaging idea. I have stainless steel probes, so I can't try the super cool twisting the thermocouple wire idea. But I have multiple probes and channels.
dwertz attached the following image:

|
|
|
|
| Gullygossner |
Posted on 01/24/2023 5:35 PM
|
|
1/4 Pounder Posts: 95 Joined: January 06, 2019 |
That is a nice looking curve, far better than anything I've been able to achieve manually. Are you noticing any better taste from your roasts? If nothing else one would be gaining consistency. |
|
|
|
| dwertz |
Posted on 01/26/2023 1:39 AM
|
|
Newbie Posts: 45 Joined: October 19, 2022 |
Thanks! It is a lot better than anything I have done manually as well. Still some work to do tuning things. You can see from the ROR there is still some ringing in the response. I am not sure I have a refined enough palate to really say the coffee is better than it is from manually controlled roasts with somewhat wobbly curves. It is definitely better than the roasts when I just lost it and everything went south. Which did happen more than I want to admit. The consistency is much better. For a given coffee, first crack always happens very close to the same time, every time. It is also much easier to pay attention to what is happening with the coffee and when to drop it. I think it makes it easier to play with development time and final temperature also. All you have to do is watch it and stop when you want to. I find that development and brewing method both have huge impact on flavor. It seems like the exact shape of the curve has a more subtle effect. But to be honest until now I did not have good enough control over the roast to explore subtle changes in the curve. I think I kind of just got lucky with the curve I drew to try out the PID, because it is making really good tasting coffee. At least to my liking. I am probably roasting darker than a lot of people on this forum. |
|
|
|
| Cymen |
Posted on 02/06/2023 3:47 PM
|
|
Newbie Posts: 12 Joined: January 13, 2023 |
I've read through this thread a bunch of times and I think I understand it. Basically: - RobotDyn dimmer is used for zero-crossing in order to time the phase angle pulses - two opticouplers are attached -- one to the transistor used to control the heater and the other the transistor for the fan, have to use resistor for 12v on the side of the opticoupler to the roaster and different resister on the side towards our microcontroller for 5v/3.3v Would something like an ESP32 be fast enough to run the loop to handle this? I assume you can hook up the zero crossing pulse to an interrupt? Some of the ESP32 variants actually have two CPU cores and I wonder if it might be possible to dedicate one to the lower level "talking to the hardware" part with the interrupt handler and the other to adding some kind of API exposed via wifi/BT to interact with the roaster from an app running somewhere else (ie phone/laptop/etc). Am I right in understanding on the lower level, the zero crossing happens and the pulses of the correct duration have to be triggered every time to maintain the current fan/heat settings (or be slightly different to alter them)? I'm a software developer who can solder and tinker with microcontrollers but on a fairly superficial level so that's the perspective I'm working from (ie I made a bread dough warmer with an ESP32, temperature probe and an SSR). After using my SR800 for a while, I'd love to be able to hook in like this with fairly minimal changes to the roaster itself. |
|
|
|
| renatoa |
Posted on 02/07/2023 12:54 AM
|
|
Administrator Posts: 3104 Joined: September 30, 2016 |
It is more than fast enough. Such things are done with Arduino Uno for more than 10 years (see TC4 project), and Uno is 10x less capable than an ESP32. Just a thing to be aware, if using WiFi some timers and ADC logic are disturbed, so better use BT (BLE) for wireless comm, if you intend. |
|
|
|
| dwertz |
Posted on 02/21/2023 3:06 AM
|
|
Newbie Posts: 45 Joined: October 19, 2022 |
Roaster is working pretty well now. This roast was outside in a mild breeze and includes me reducing the fan from 60% to 35% in ~5% steps. I made a modification to the integral equation. I don't allow the integral to change if the error term is getting smaller. This prevents the integral from winding up when the error is large but headed in the right direction. The change got rid of the large overshoots.
dwertz attached the following image:

Edited by dwertz on 02/21/2023 3:12 AM |
|
|
|
| DiyDan |
Posted on 03/04/2024 8:15 PM
|
 Newbie Posts: 5 Joined: March 04, 2024 |
I read through this entire thread and I�m amazing what you all have done. It sounds like you have in depth knowledge of how the Fresh Roast works. I have a couple questions. I�m new to roasting but a long time tinkerer. I�m using the SR540 w/ext tube and also getting frustrated with the stock control limitations. I don�t have the controls experience to do what you all have done, but as the OP discussed to start this thread, my inclination is that a separate manual fan control would give much better control. 1) Do you think a separate manual fan control is at all possible and would be a good 90% solution? 2) Do you know how this could be done? Would it need a different fan because of how the fan is powered? |
|
|
|

| Jump to Forum: |
Powered by PHP-Fusion Copyright © 2024 PHP-Fusion Inc
Released as free software without warranties under GNU Affero GPL v3
Designed with ♥ by NetriXHosted by skpacman