
Login

Shoutbox
You must login to post a message.
renatoa
07/26/2024 3:49 PM
Bill grubbe and Jk, 
allenb
07/26/2024 5:15 AM
Spiderkw Welcome to HRO!

renatoa
07/24/2024 8:31 AM
ramiroflores and John123,

 ?
?
?renatoa
07/21/2024 1:18 AM
 , Luislobo
renatoa
07/19/2024 11:28 AM
Koepea,
Forum Threads
Newest Threads
Skywalker roaster modsBackground Roast Iss...
Hello from Arkansas
TC4ESP
Green coffee reviews
Hottest Threads
| Skywalker roaster... | [375] |
| TC4ESP | [115] |
| War on Farmers by... | [47] |
| Adventures in flu... | [26] |
| Hello! (soon) Roa... | [17] |
In Memory Of Ginny

Donations
Latest Donations
dmccallum - 10.00
JackH - 25.00
snwcmpr - 10.00
Anonymous - 2.00
Anonymous - 5.00
dmccallum - 10.00
JackH - 25.00
snwcmpr - 10.00
Anonymous - 2.00
Anonymous - 5.00
Users Online
Guests Online: 8
Members Online: 0
Total Members: 8,394
Newest Member: Bill grubbe
Members Online: 0
Total Members: 8,394
Newest Member: Bill grubbe
View Thread
Who is here? 1 guest(s)
 Roast Profile
|
|
| CK |
Posted on 12/24/2023 8:47 PM
|
|
1/2 Pounder  Posts: 252 Joined: December 07, 2018 |
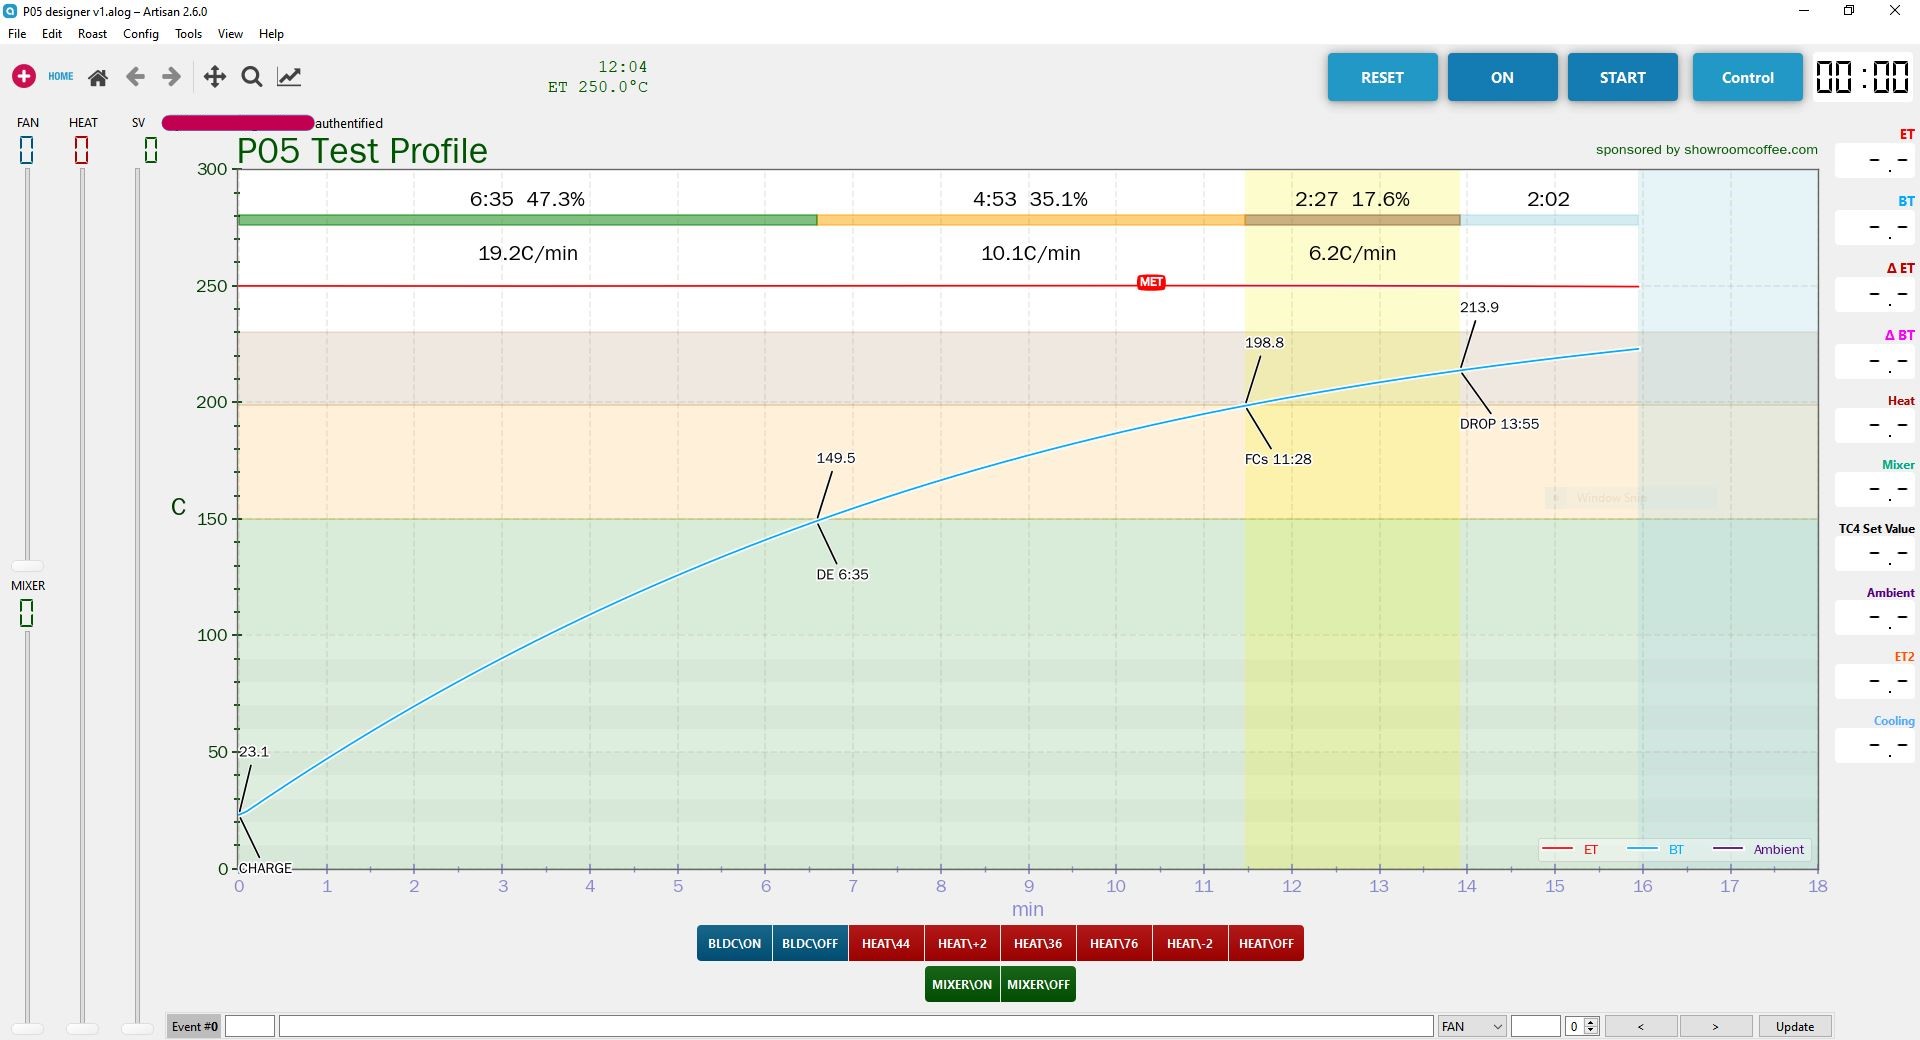
This profile is turning out some great results... For the past few months, I've changed my style to replicate roasts similar to this curve and the results have been surprisingly good... no more vegetal or sour flavors from roasts that are too short or too fast. An interesting observation is that despite the longer dry and maillard phases, the acidity of Ethiopian naturals is still very present if dropped with low development time. On my roast color meter, they generally range from 80-110 on the Agtron gourmet scale and all are very good, either as espresso or as a filter brew.
CK attached the following image:
|
|
|
|
| oldgrumpus |
Posted on 12/24/2023 11:08 PM
|
|
1/2 Pounder Posts: 225 Joined: July 25, 2012 |
I'd like to try that with my Ethiopian. Since I'm roasting with a drum, it'll be interesting to see if I can come to the same conclusion. Thanks for posting!
Clever Coffee Dripper
Grinder: Macap M4 Roaster: Completed drum roaster project photos shown here: Photos https://goo.gl/ph...Da6K4wfqw5 Videos https://www.youtu...Bd1NrdpSUH Build thread https://homeroast...post_38189 |
|
|
|
| renatoa |
Posted on 12/25/2023 7:39 AM
|
|
Administrator Posts: 3104 Joined: September 30, 2016 |
CK, so you start with really cold machine, no preheat ? |
|
|
|
| oldgrumpus |
Posted on 12/25/2023 9:20 AM
|
|
1/2 Pounder Posts: 225 Joined: July 25, 2012 |
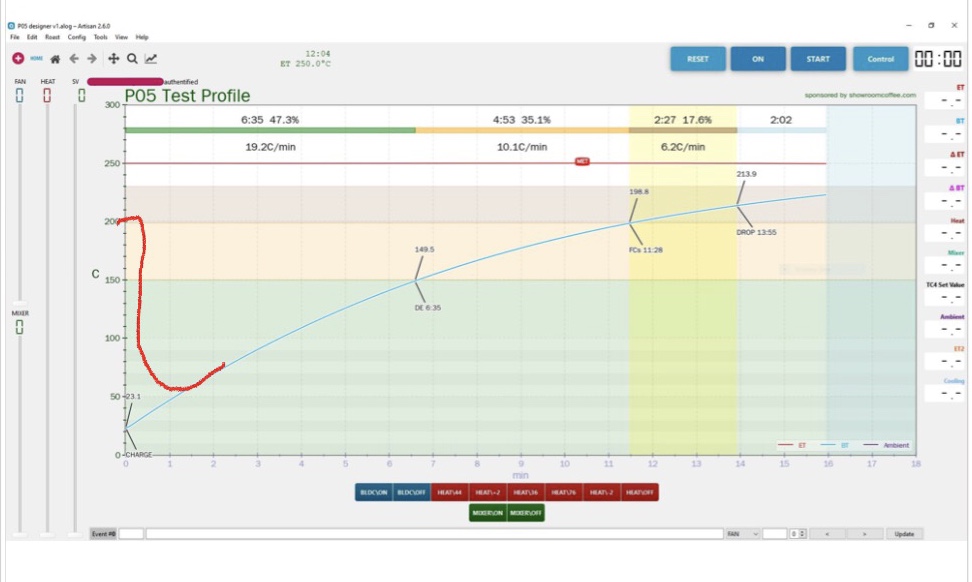
It would look something like this. The red line indicates the charge but that line would join the profile.
oldgrumpus attached the following image:
Clever Coffee Dripper
Grinder: Macap M4 Roaster: Completed drum roaster project photos shown here: Photos https://goo.gl/ph...Da6K4wfqw5 Videos https://www.youtu...Bd1NrdpSUH Build thread https://homeroast...post_38189 |
|
|
|
| CK |
Posted on 12/25/2023 11:20 AM
|
|
1/2 Pounder Posts: 252 Joined: December 07, 2018 |
This curve shows the temperature as seen from the beans perspective; they enter at room temperature of 23C and make their milestones from there. Every machine has different characteristics for charge temperature and probe readings so it’s easier to show from the starting point… if the milestones are met similarly, the start of the curve should be similar. I like how FransG does it by putting the bean probe in the FZ94 machine after charging. This shows the beans actual temperature rise without a turn point as seen in this post. https://kostverlo...y-end.html |
|
|
|
| renatoa |
Posted on 12/25/2023 11:35 AM
|
|
Administrator Posts: 3104 Joined: September 30, 2016 |
Dang... great minds ! Already thinking to a mini trier like mechanism for this purpose...  |
|
|
|
| Yasu |
Posted on 12/26/2023 10:51 PM
|
 1/4 Pounder  Posts: 75 Joined: March 27, 2022 |
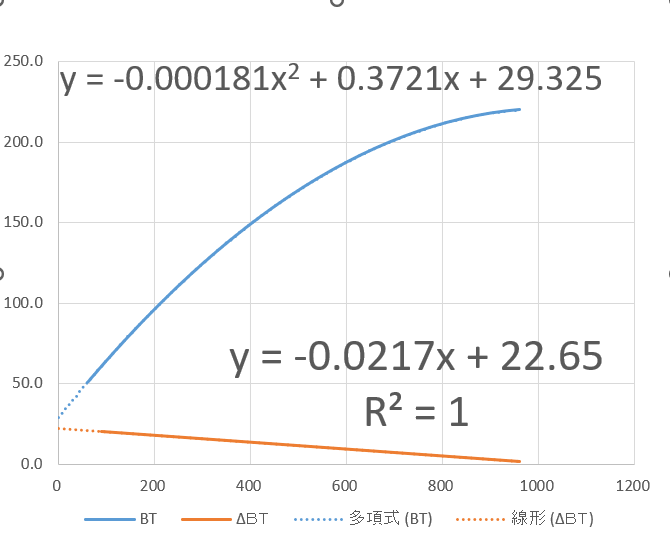
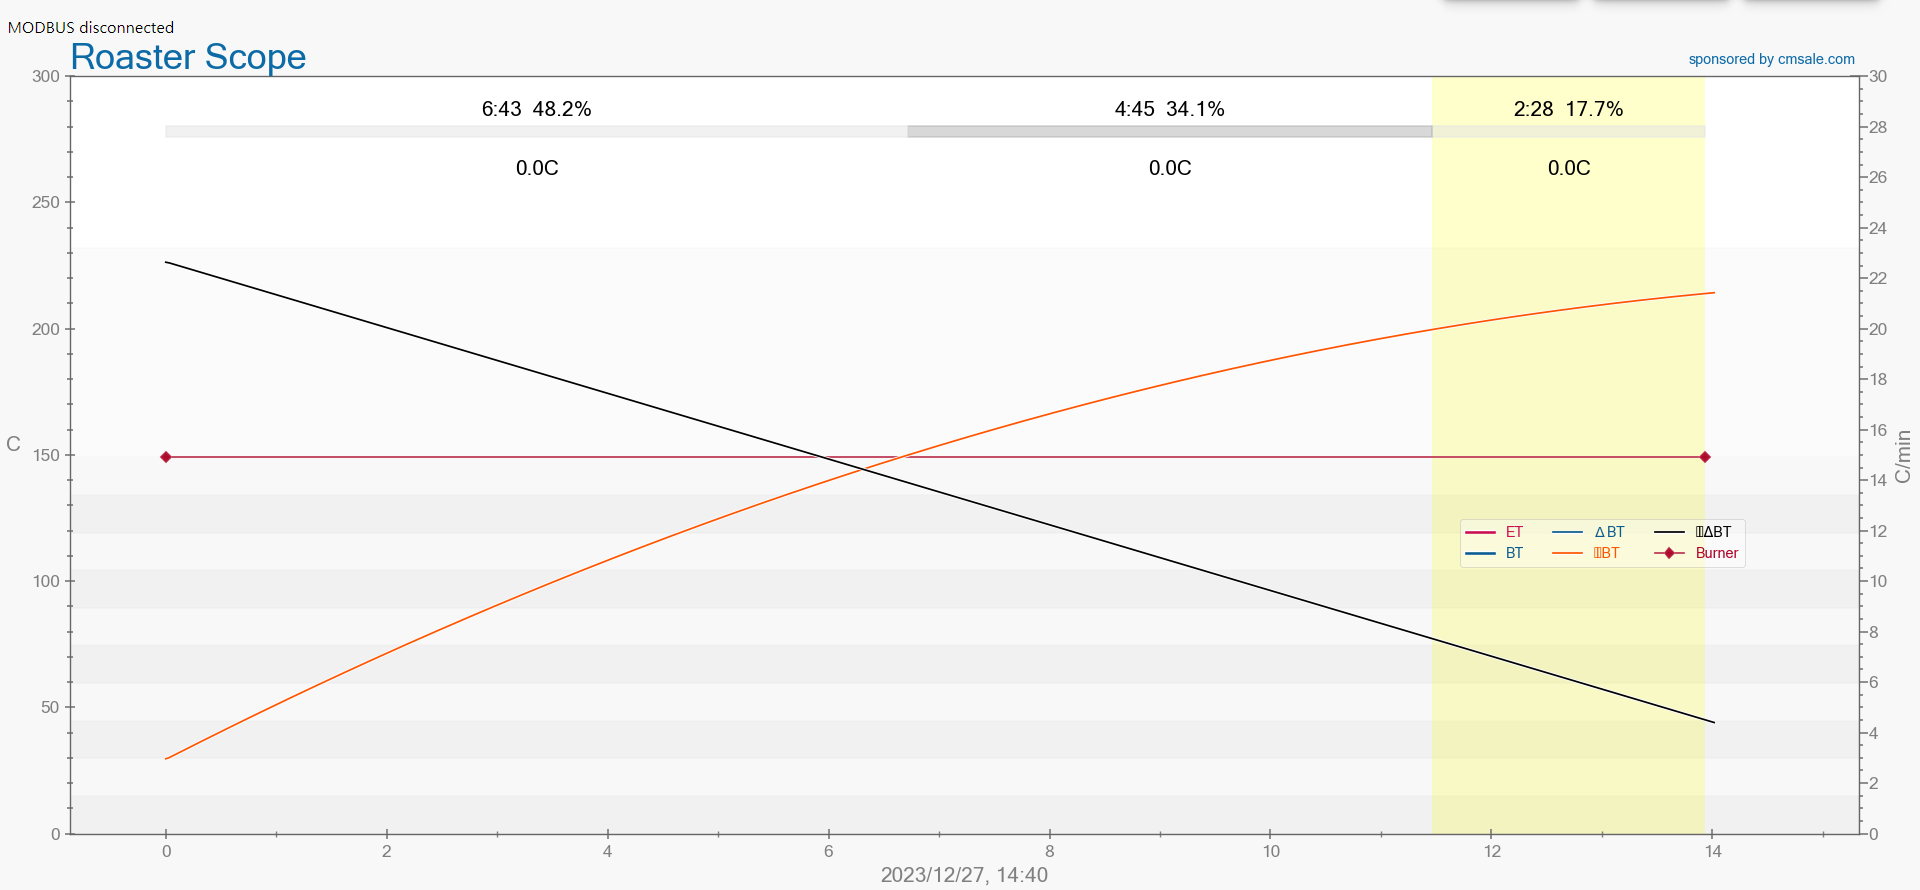
I plotted the temperature. I think it is a pretty good curve. I turned it into a formula with an approximate curve, so I was able to put this formula into Artisan's device to display the target line, which I will copy next time. Substituting time t for x, we get BT and ROR target values at that time.
Yasu attached the following images:
Edited by Yasu on 12/27/2023 12:00 AM |
|
|
|
| renatoa |
Posted on 12/27/2023 1:51 AM
|
|
Administrator Posts: 3104 Joined: September 30, 2016 |
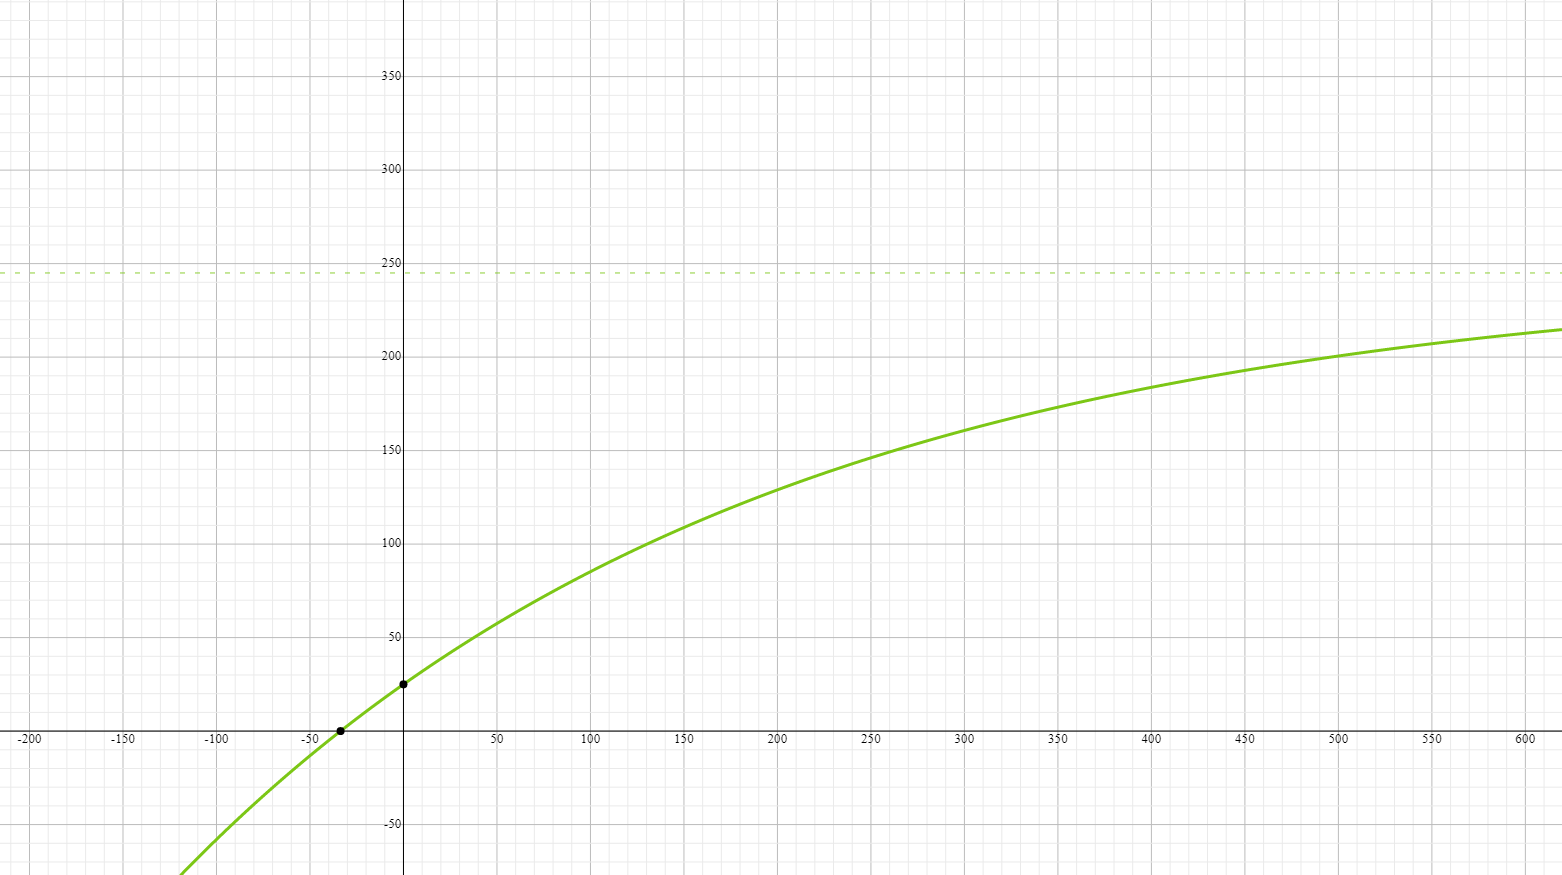
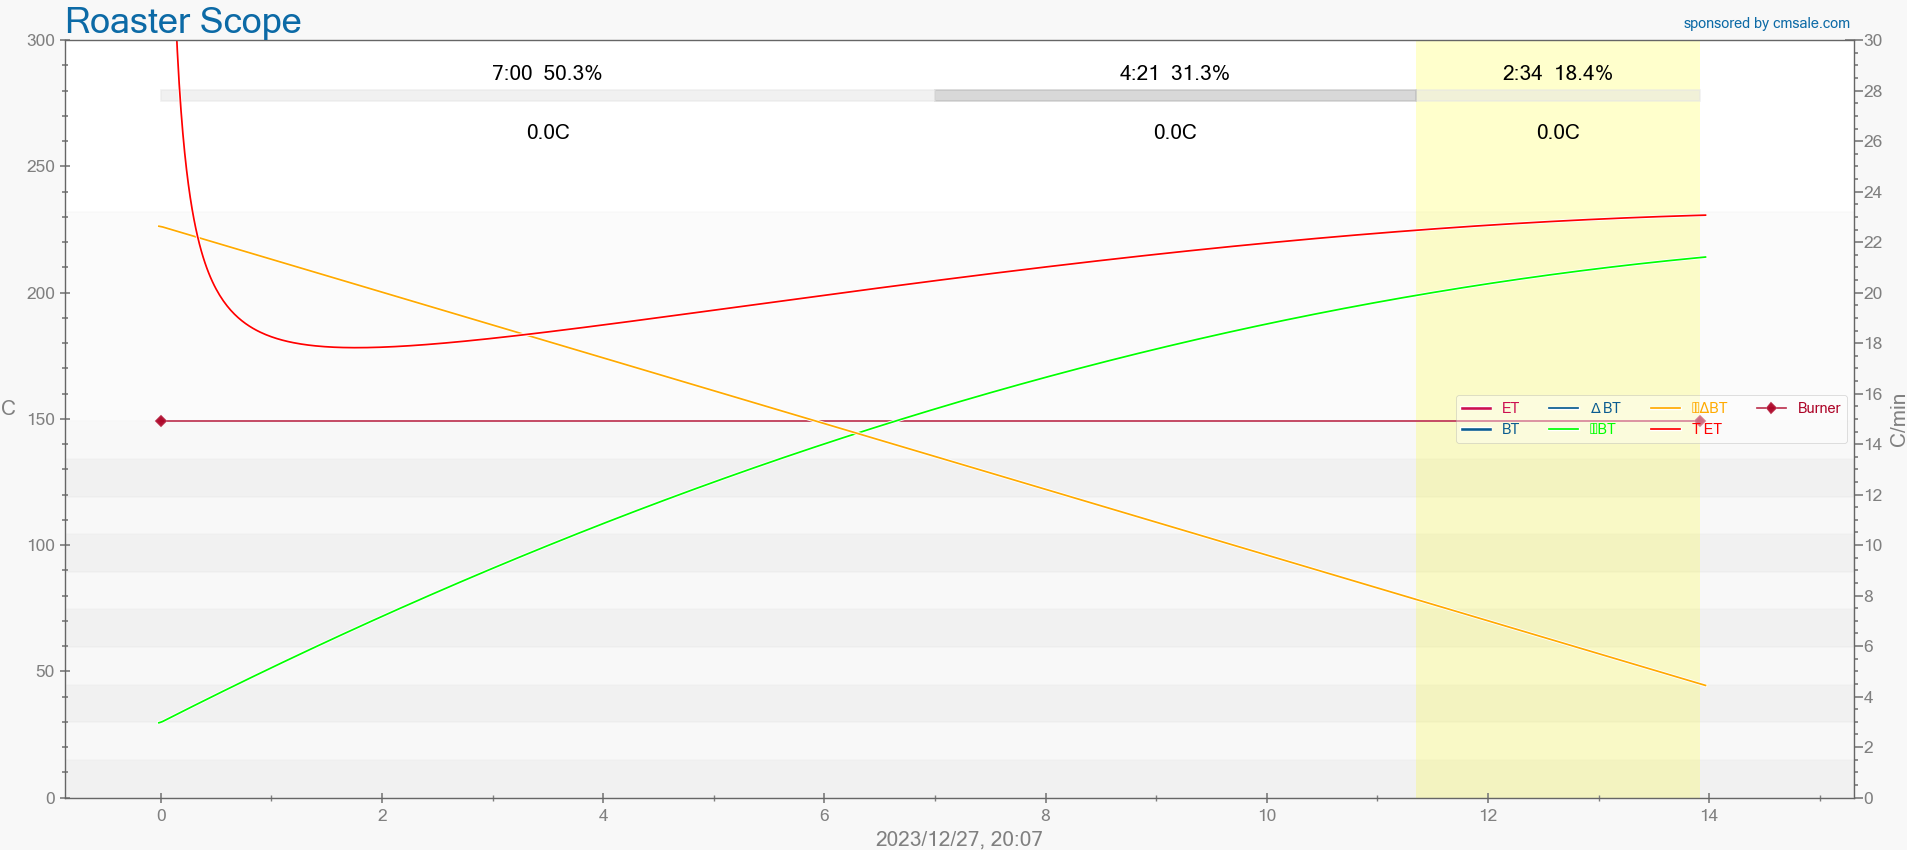
You can read more about the the formula of BT in the "Well tempered..." thread, it's the heat absorption of a body immersed in an environment with different temperature. BT = AT + (ET-AT) * (1 - EXP(-t/k))) where t is time, in seconds, and k is a constant specific to machine/beans/anything else. You can try for start with a k value of 0.0032. If using 245 as value for ET, and 25 for AT, the curve you get is attached below. DE typical value of 150C is at 4:20, and FC (200C) at minute 8. Playing with various ET will give you virtual roasts shorter or longer. You can use this tool for plotting the graph: https://www.symbo...calculator ~~~
renatoa attached the following image:
|
|
|
|
| Yasu |
Posted on 12/27/2023 3:00 AM
|
|
1/4 Pounder Posts: 75 Joined: March 27, 2022 |
Renatoa. Thank you for the instruction. Since you mentioned that BT will be a function of ET, so we will control ET. I just tried to display the target value of BT before that in Artisan for ROR and BT when ROR is reduced by a certain amount, as RAO said, so I will see if I can't have Artisan calculate ET once to make this BT and display that too. Thank you very much. However, I am still able to manage roasting with heater + burner while watching BT and ROR. |
|
|
|
| renatoa |
Posted on 12/27/2023 3:59 AM
|
|
Administrator Posts: 3104 Joined: September 30, 2016 |
Forgot to mention, that formula is for roasters using mainly hot air as heat transfer method. Will not apply for radiant roasters, where ET is colder even than the beans ! RoR reduction comes natural, without any change, for this model. You can see this if plotting in the same graph the derivative of the profile curve. All you have to do is to maintain firm ET until the neighborhood of the exothermal phase, about one minute before FC. Obviously, this formula don't cover the FC flick and crash, no information about beans releasing steam. |
|
|
|
| Yasu |
Posted on 12/27/2023 5:31 AM
|
|
1/4 Pounder Posts: 75 Joined: March 27, 2022 |
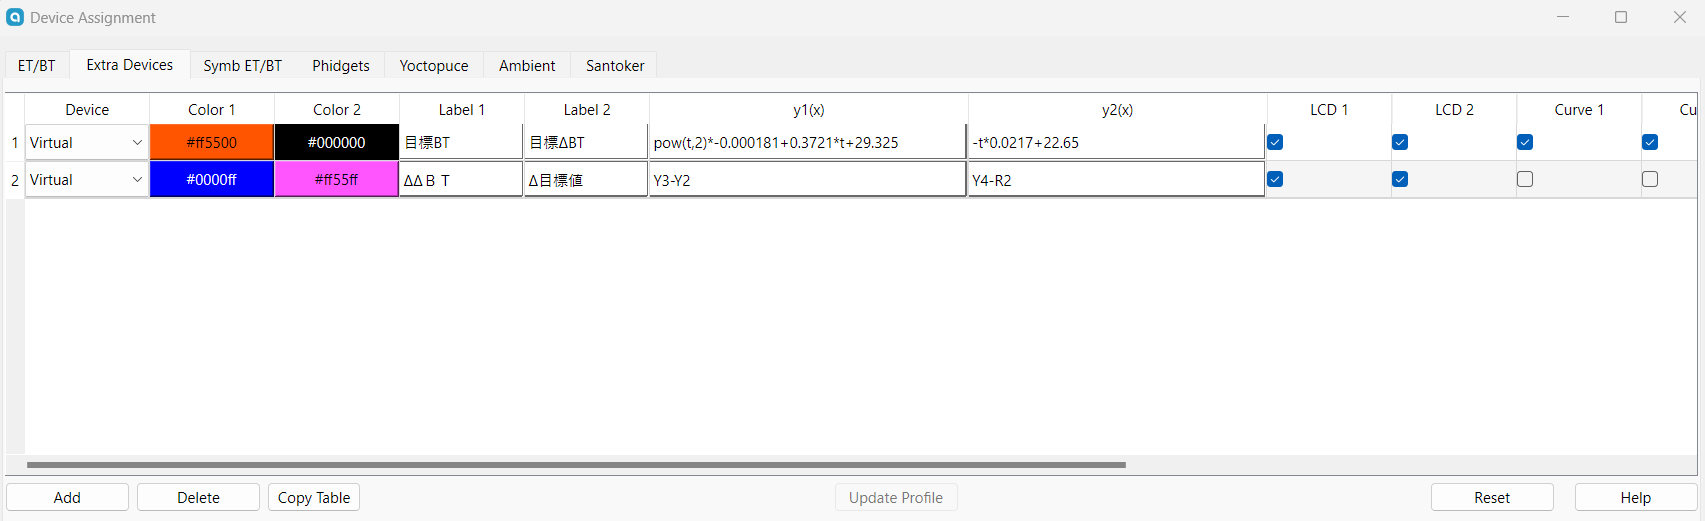
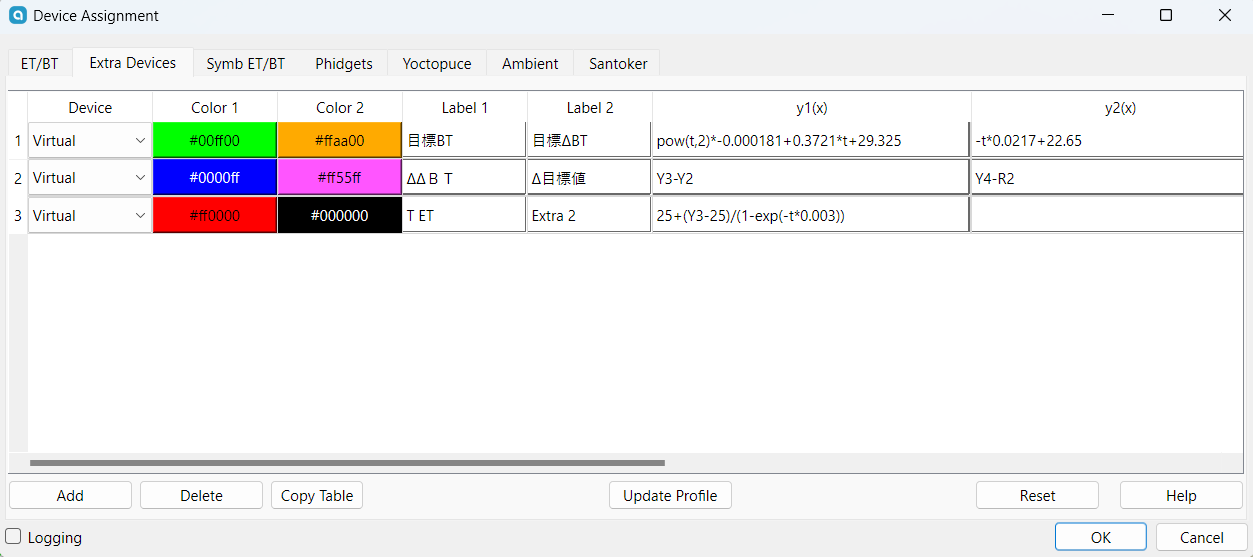
Thank you very much. I put the formula you gave me into the Artisan device and also wrote a target curve for ET. For now, I will try to use about K=0.0030 based on past data. I am looking forward to the next roasting.
Yasu attached the following images:
|
|
|
|

| Jump to Forum: |
Powered by PHP-Fusion Copyright © 2024 PHP-Fusion Inc
Released as free software without warranties under GNU Affero GPL v3
Designed with ♥ by NetriXHosted by skpacman